使用VisualVM分析Logstash
在Logstash中使用Syslog接收数据到Redis时遇到了一些性能问题,调整pipeline的参数后有一定的提升但并不理想,咨询铭毅天下老师后,老师提供了几个优化点,还有几篇性能调优的文章。其中一篇官方文档Tuning and Profiling Logstash Performance提到了在调整Logstash时,可能需要调整堆大小,可以使用VisualVM工具来分析。那么,来学学VisualVM怎么玩😃
环境介绍
我是在自己的机器上先测试的,环境如下:
- Windows 10主机,已安装JDK 8
- 2台Ubuntu 1804虚拟机,直接使用了上篇文章Nginx日志通过Syslog发送到ELK的环境,不过是把Logstash Output改成了Redis
1
2
3
4
5
6
7
8
9
10
11
12
13
14
15
16
17
18
19
20
21
22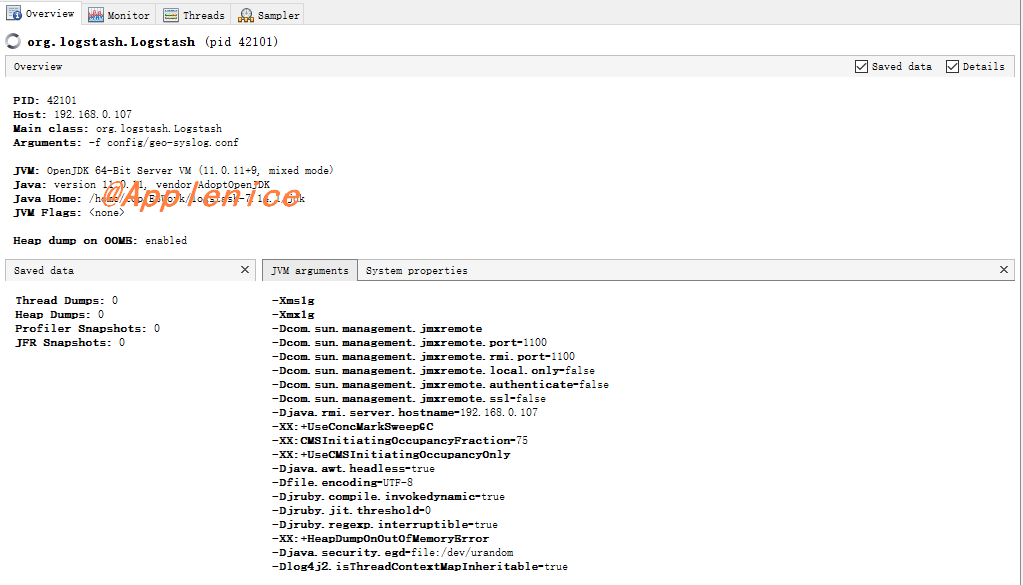
23cat config/geo-syslog.conf
input {
syslog {
port => "514"
type => "geo-syslog"
}
filter {
mutate {
remove_field => ["@version", "host"]
}
}
output {
redis {
host => "127.0.0.1"
port => 6379
data_type => "list"
key => "GEO_SYSLOG"
db => 0
password => XXXXXXX
}
}
前置知识
VisualVM介绍
下载地址: https://visualvm.github.io/
关于VisualVM是什么,官网介绍如下:
VisualVM is a visual tool integrating commandline JDK tools and lightweight profiling capabilities. Designed for both development and production time use.
因为已经安装了JDK,所以我选择的Download Standalone,下载完成后解压即启动,可以查看当前主机的JVM数据。不过我需要使用Remote模式,还得在Logstash所在机器上进行配置。
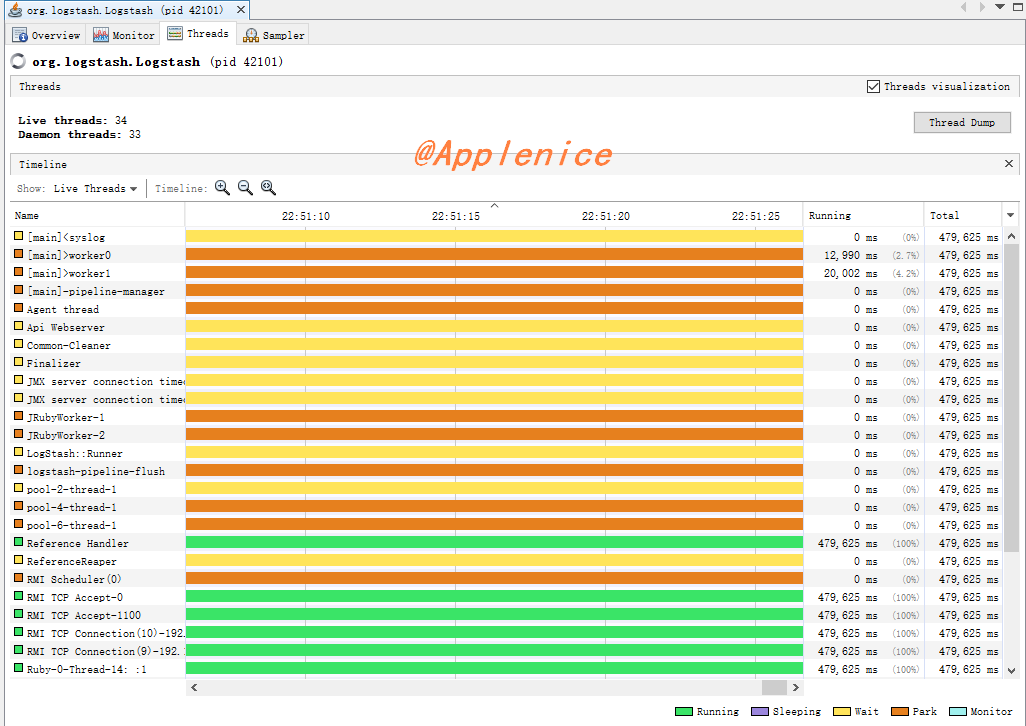
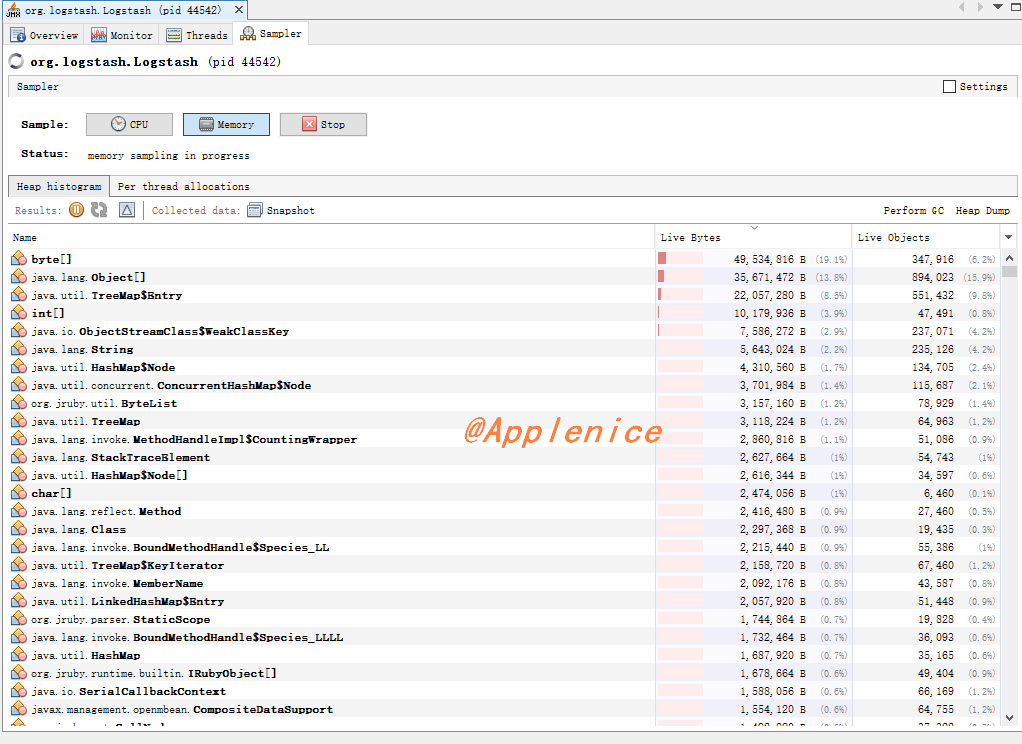
VisualVM连接远程节点有2种方式:jstatd和jmx。其中jstatd支持monitor,jmx支持threads、sampler。
jstatd
jstatd命令是一个RMI(Remote Method Invocation,远程方法调用)服务器应用程序,它监视已检测的Java HotSpot VM的创建和终止,并提供一个接口以使远程监视工具能够连接到在本地主机上运行的JVM。
JMX
JMX(Java Management Extensions)是Java自带的开箱即用的管理工具和接口。
远程主机配置
1、需要确认Logstash所在的虚拟机IP地址,并保证hosts文件中写入了主机和IP地址。
1 | cat /etc/hosts |
2、所在虚拟机需要安装JDK,并配置了JAVA_HOME。
1 | java -version |
3、切换到root用户,创建文件jstatd.all.policy,写入以下内容:
1 | grant codebase "file:${java.home}/../lib/tools.jar" { |
4、执行命令:
1 | jstatd -J-Djava.security.policy=jstatd.all.policy -J-Djava.rmi.server.hostname=192.168.0.107 -p 1099 |
这时已经在Logstash所在虚拟机上启动了jstatd,端口使用VisualVM默认添加端口1099,执行前建议使用netstat查看是否有端口冲突。
5、Logstah的config/jvm.options文件中增加如下一行:
1 | -Dcom.sun.management.jmxremote -Dcom.sun.management.jmxremote.port=1100 -Dcom.sun.management.jmxremote.rmi.port=1100 -Dcom.sun.management.jmxremote.local.only=false -Dcom.sun.management.jmxremote.authenticate=false -Dcom.sun.management.jmxremote.ssl=false -Djava.rmi.server.hostname=192.168.0.107 |
如果该步骤不做的话,VisualVM的CPU处会显示Not supported for this JVM,同时Threads选项卡无法体现,Sampler选项卡也是无法使用的。
VisualVM添加Remote
1、在Applications->Remote处右键添加远程主机,可以在Advanced Settings中对jstatd的端口号进行相应地调整。添加完毕后,可以看到jstatd和其他正在运行的JAVA进程。
2、在已经添加的主机上右键->Add JMX Connection->添加上面Logstah的config/jvm.options文件配置的端口号。
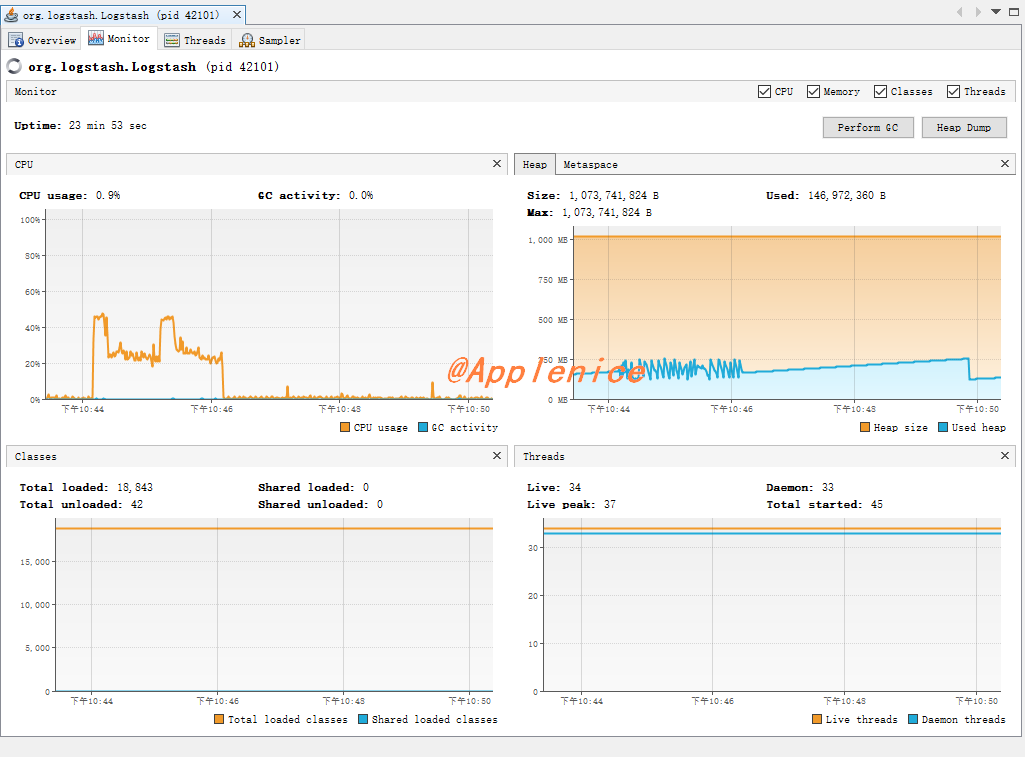
接下来就可以查看监控信息啦:
参考
1、https://www.elastic.co/guide/en/logstash/current/tuning-logstash.html#profiling-the-heap
2、https://docs.oracle.com/javase/8/docs/technotes/tools/unix/jstatd.html
3、https://stackoverflow.com/questions/32515727/jvisualvm-connect-to-remote-jstatd-not-showing-applications
4、https://blog.csdn.net/u013905744/article/details/80936264