快两个月没写笔记了,工作中遇到了日志采集处理的问题,就回来学习、测试下通过Syslog采集日志。
Syslog 简单介绍 Syslog一般用于收集各种设备的日志进行集中处理。Linux上自带rsyslog,兼容Syslog语法,在Syslog基础上增加了更多协议的支持,配合额外module插件可以完成很多场景的使用。可以查看下当前的版本:
1
2
3
4
5
6
7
8
9
10
11
12
13
14
15
16
$ rsyslogd -version rsyslogd 8.32.0, compiled with: PLATFORM: x86_64-pc-linux-gnu PLATFORM (lsb_release -d): FEATURE_REGEXP: Yes GSSAPI Kerberos 5 support: Yes FEATURE_DEBUG (debug build, slow code): No 32bit Atomic operations supported: Yes 64bit Atomic operations supported: Yes memory allocator: system default Runtime Instrumentation (slow code): No uuid support: Yes systemd support: Yes Number of Bits in RainerScript integers: 64 See http://www.rsyslog.com for more information.
在RFC 3164中定义了Syslog的Facility、Severity等。其中Facility可以理解为日志类型或者日志设备,就是标记由谁产生的日志:
1
2
3
4
5
6
7
8
9
10
11
12
13
14
15
16
17
18
19
20
21
22
23
24
25
26
27
Numerical Facility Code 0 kernel messages 1 user-level messages 2 mail system 3 system daemons 4 security/authorization messages (note 1) 5 messages generated internally by syslogd 6 line printer subsystem 7 network news subsystem 8 UUCP subsystem 9 clock daemon (note 2) 10 security/authorization messages (note 1) 11 FTP daemon 12 NTP subsystem 13 log audit (note 1) 14 log alert (note 1) 15 clock daemon (note 2) 16 local use 0 (local0) 17 local use 1 (local1) 18 local use 2 (local2) 19 local use 3 (local3) 20 local use 4 (local4) 21 local use 5 (local5) 22 local use 6 (local6) 23 local use 7 (local7)
Nginx在设置Facility时,默认是local7。Severity用于设置日志级别:
1
2
3
4
5
6
7
8
9
10
Numerical Severity Code 0 Emergency: system is unusable 1 Alert: action must be taken immediately 2 Critical: critical conditions 3 Error: error conditions 4 Warning: warning conditions 5 Notice: normal but significant condition 6 Informational: informational messages 7 Debug: debug-level messages
服务器模式 当需要rsyslog以服务器模式运行时,需要编辑配置文件/etc/rsyslog.conf,取消UDP、TCP的注释:
1
2
3
4
5
6
7
# provides UDP syslog reception module(load="imudp") input(type="imudp" port="514") # provides TCP syslog reception module(load="imtcp") input(type="imtcp" port="514")
修改完以后重启rsyslog服务,可以通过netstat查看开放端口。
Nginx配置 我这里使用Nignx进行测试,新建一个最小配置文件,为了方便后续的日志分析,将日志格式修改为json格式,定义名字为jsonlog,其中将access_log以jsonlog的格式记录在指定path,并发送到指定的syslog server。需要注意severity=info jsonlog,如果只配置了日志级别,没有指定jsonlog,那么发送给syslog server的数据是default格式的。
1
2
3
4
5
6
7
8
9
10
11
12
13
14
15
16
17
18
19
20
21
22
23
24
25
26
27
28
29
30
31
32
33
34
35
http { include mime.types; default_type application/octet-stream; sendfile on; keepalive_timeout 65; log_format jsonlog escape=json '{' '"remote_addr":\"$remote_addr\",' '"time_local":\"$time_local\",' '"request":\"$request\",' '"status": \"$status\",' '"body_bytes_sent":\"$body_bytes_sent\",' '"http_referrer":\"$http_referer\",' '"http_user_agent":\"$http_user_agent\"' '}'; upstream geo { server mytest.com; } server { listen 80; server_name 192.168.0.118; location ^~/geo/ { proxy_http_version 1.1; proxy_set_header Connection ""; proxy_set_header Host ip-api.com; rewrite ^/geo/(.*)$ /json/$1 break; proxy_pass http://geo; access_log /usr/local/src/nginx/logs/geo_syslog.log jsonlog; access_log syslog:server=192.168.0.108:514,facility=local7,tag=nginx_geo_access_log,severity=info jsonlog; } }
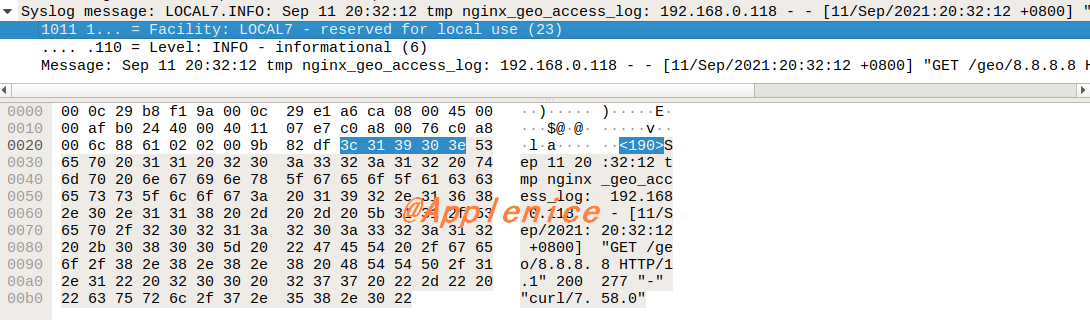
如果上面启动了服务器模式,可以在syslog server所在机器上查看日志:
1
2
3
4
5
$ tail -f /var/log/syslog# severity=info Sep 11 20:32:12 tmp nginx_geo_access_log: 192.168.0.118 - - [11/Sep/2021:20:32:12 +0800] "GET /geo/8.8.8.8 HTTP/1.1" 200 277 "-" "curl/7.58.0" # severity=info jsonlog Sep 11 20:04:46 tmp nginx_geo_access_log: {"remote_addr":"192.168.0.118","time_local":"11/Sep/2021:20:04:46 +0800","request":"GET /geo/8.8.8.8 HTTP/1.1","status": "200","body_bytes_sent":"277","http_referrer":"","http_user_agent":"curl/7.58.0"}
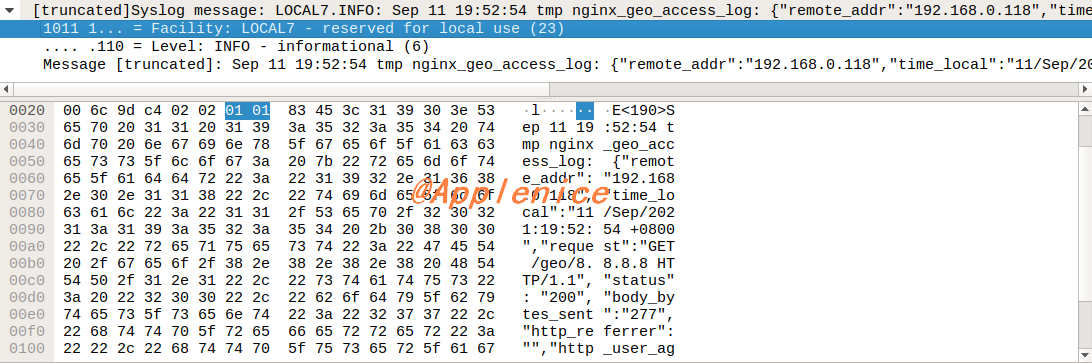
如果因为权限问题,无法登录syslog server,可以在curl发起请求之前,启动tcpdump抓包查看日志是否发送正常,是否为JSON格式,下面我抓取的数据包,通过Wireshark可以看到Syslog记录:
场景一 这里的收集方案:假设Nginx在A机器,Logstash配置成的syslog服务器在B机器。
发送到ElasticSearch 如果使用Logstash收集日志,那么需要暂停B机器上的rsyslog服务(注释UDP、TCP,重启服务)。启动logstash之前,需要新建一个配置文件,我直接放在config目录中了。
1
2
3
4
5
6
7
8
9
10
11
12
13
14
15
16
17
18
19
20
21
22
23
24
$ cat config/geo-syslog.conf input { syslog { port => "514" type => "geo-syslog" } } filter { json { source => "message" target => "content" } mutate { remove_field => ["@version", "host", "message"] } } output { elasticsearch { hosts => ["127.0.0.1:9200"] index => "geo-syslog-%{+YYYY.MM.dd}" } }
启动Logstash,注意因为使用了514端口,这里需要用root用户启动,实际使用时可以用非知名端口:
1 $ ./bin/logstash -f config/geo-syslog.conf
启动成功,向Nignx服务发起curl请求后,在Kibana中查看index数据:
1
2
3
4
5
6
7
8
9
10
11
12
13
14
15
16
17
18
19
20
21
22
23
24
25
26
27
{ "_index" : "geo-syslog-2021.09.11" , "_type" : "_doc" , "_id" : "N3AX1XsBEY2zRj3H2ELN" , "_score" : 1.0 , "_source" : { "content" : { "status" : "200" , "request" : "GET /geo/8.8.8.8 HTTP/1.1" , "body_bytes_sent" : "277" , "http_referrer" : "" , "remote_addr" : "192.168.0.118" , "http_user_agent" : "curl/7.58.0" , "time_local" : "11/Sep/2021:21:41:54 +0800" } , "priority" : 190 , "@timestamp" : "2021-09-11T13:41:54.000Z" , "program" : "nginx_geo_access_log" , "logsource" : "tmp" , "severity" : 6 , "facility" : 23 , "type" : "geo-syslog" , "facility_label" : "local7" , "timestamp" : "Sep 11 21:41:54" , "severity_label" : "Informational" } }
发送到其他程序 如果需要通过Logstash output到其他程序进行二次处理,比如我要通过UDP接收logstash发送过来的数据,修改配置文件:
1
2
3
4
5
6
output { udp { host => "192.168.0.113" port => "8777" } }
如果需要安装插件,可以通过如下命令:
1
2
./bin/logstash-plugin install logstash-output-udp ./bin/logstash-plugin install logstash-input-udp
已经安装了哪些插件,可以通过如下命令查看:
1 ./bin/logstash-plugin list
在接收端收到的消息和在Kibana中看到的一致:
1 { "severity" : 6 , "facility" : 23 , "priority" : 190 , "logsource" : "tmp" , "@timestamp" : "2021-09-11T14:07:54.000Z" , "timestamp" : "Sep 11 22:07:54" , "type" : "geo-syslog" , "content" : { "http_referrer" : "" , "remote_addr" : "192.168.0.118" , "time_local" : "11/Sep/2021:22:07:54 +0800" , "http_user_agent" : "curl/7.58.0" , "status" : "200" , "request" : "GET /geo/8.8.8.8 HTTP/1.1" , "body_bytes_sent" : "277" } , "facility_label" : "local7" , "severity_label" : "Informational" , "program" : "nginx_geo_access_log" }
场景二 这里的收集方案:假设Nginx在A机器,rsyslog运行在B机器,Nginx需要发送日志到syslog server,再由syslog server将日志发送Logstash。
配置rsyslog 在rsyslog服务器模式的基础上,需要在/etc/rsyslog.d目录里增加配置:
1
2
3
4
5
6
7
8
9
10
11
12
13
14
$ cat 01-json-template.conftemplate(name="json-template" type="list") { constant(value="{") constant(value="\"@timestamp\":\"") property(name="timereported" dateFormat="rfc3339") constant(value="\",\"@version\":\"1") constant(value="\",\"message\":\"") property(name="msg" format="json") constant(value="\",\"sysloghost\":\"") property(name="hostname") constant(value="\",\"severity\":\"") property(name="syslogseverity-text") constant(value="\",\"facility\":\"") property(name="syslogfacility-text") constant(value="\",\"programname\":\"") property(name="programname") constant(value="\",\"procid\":\"") property(name="procid") constant(value="\"}\n") }
2、扩展配置
1
2
3
4
5
$ cat 60-output.conf# This line sends all lines to defined IP address at port 10514, # using the "json-template" format template *.* @192.168.0.108:10514;json-template
其中@代表使用UDP发送。
配置Logstash 1 2 3 4 5 6 7 8 9 10 11 12 13 14 15 16 17 18 19 input { udp { port => "10514" type => "syslog" } } filter { mutate { remove_field => ["@version", "host"] } } output { elasticsearch { hosts => ["127.0.0.1:9200"] index => "geo-syslog-%{+YYYY.MM.dd}" } }
启动服务 1 2 ./bin/logstash -f config/geo-syslog.conf systemctl restart rsyslog
启动以后在Kibana中会看到各种类型的日志:
1 2 3 4 5 6 7 8 9 10 11 "_source" : { "message" : """{"@timestamp":"2021-09-11T23:58:38.612793+08:00","@version":"1","message":" [origin software=\"rsyslogd\" swVersion=\"8.32.0\" x-pid=\"29039\" x-info=\"http:\/\/www.rsyslog.com\"] start","sysloghost":"top","severity":"info","facility":"syslog","programname":"rsyslogd","procid":"-"}""", "@timestamp" : "2021-09-11T15:58:38.676Z", "type" : "syslog" } "_source" : { "message" : """{"@timestamp":"2021-09-11T23:59:06+08:00","@version":"1","message":" {\"remote_addr\":\"192.168.0.118\",\"time_local\":\"11\/Sep\/2021:23:59:06 +0800\",\"request\":\"GET \/geo\/1.1.1.1 HTTP\/1.1\",\"status\": \"200\",\"body_bytes_sent\":\"325\",\"http_referrer\":\"\",\"http_user_agent\":\"curl\/7.58.0\"}","sysloghost":"tmp","severity":"info","facility":"local7","programname":"nginx_geo_access_log","procid":"-"}""", "@timestamp" : "2021-09-11T15:59:06.144Z", "type" : "syslog" }
omelasticsearch Rsyslog支持直接输出数据给Elasticsearch,但是需要安装模块:
1 sudo apt install rsyslog-elasticsearch
编辑扩展配置文件/etc/rsyslog.d/60-output.conf,并重启Rsyslog服务:
1 2 3 4 5 6 7 8 9 10 11 12 13 14 15 16 17 18 19 20 21 22 23 24 module(load="omelasticsearch") template(name="testTemplate" type="list" option.json="on") { constant(value="{") constant(value="\"timestamp\":\"") property(name="timereported" dateFormat="rfc3339") constant(value="\",\"message\":\"") property(name="msg") constant(value="\",\"host\":\"") property(name="hostname") constant(value="\",\"severity\":\"") property(name="syslogseverity-text") constant(value="\",\"facility\":\"") property(name="syslogfacility-text") constant(value="\",\"syslogtag\":\"") property(name="syslogtag") constant(value="\"}") } action(type="omelasticsearch" server="127.0.0.1" serverport="9200" template="testTemplate" searchIndex="test-index" searchType="test-type" bulkmode="on" queue.type="linkedlist" queue.size="5000" queue.dequeuebatchsize="300" action.resumeretrycount="-1")
启动以后在Kibana中会看到各种类型的日志:
1 2 3 4 5 6 7 8 9 10 11 12 13 14 15 16 17 "_source" : { "timestamp" : "2021-09-12T00:45:01+08:00", "message" : """ {"remote_addr":"192.168.0.118","time_local":"12/Sep/2021:00:45:01 +0800","request":"GET /geo/1.1.1.1 HTTP/1.1","status": "200","body_bytes_sent":"325","http_referrer":"","http_user_agent":"curl/7.58.0"}""", "host" : "tmp", "severity" : "info", "facility" : "local7", "syslogtag" : "nginx_geo_access_log:" } "_source" : { "timestamp" : "2021-09-12T00:44:34.449310+08:00", "message" : """ [origin software="rsyslogd" swVersion="8.32.0" x-pid="30316" x-info="http://www.rsyslog.com"] start""", "host" : "top", "severity" : "info", "facility" : "syslog", "syslogtag" : "rsyslogd:" }
参考 1、http://nginx.org/en/docs/syslog.html https://datatracker.ietf.org/doc/html/rfc3164#section-4.1.1 https://tufin.medium.com/sending-nginx-access-logs-to-a-golang-server-over-syslog-98b9108f40e1 https://www.elastic.co/cn/blog/how-to-centralize-logs-with-rsyslog-logstash-and-elasticsearch-on-ubuntu-14-04 https://discuss.elastic.co/t/udp-listener-died-syslog-when-running-as-a-service/128890 https://askubuntu.com/questions/26237/difference-between-var-log-messages-var-log-syslog-and-var-log-kern-log https://doc.yonyoucloud.com/doc/logstash-best-practice-cn/ecosystem/rsyslog.html https://rsyslog.readthedocs.io/en/latest/configuration/modules/omelasticsearch.html