又多叒是那台跑着开源平台的测试机,不知为何性能一直上不去,没找到原因在哪里,所以想着搭一个监控系统,综合各种指标看一下,分析下问题出在哪里。搜索了一下,Prometheus和Grafana目前是比较流行的,那就开工吧。
介绍
Prometheus
根据Prometheus官网的描述,Prometheus是一套开源的系统监控报警框架。由SoundCloud在2012年创建,作为社区开源项目进行开发。2016年,Prometheus正式加入Cloud Native Computing Foundation,成为受欢迎度仅次于Kubernetes的项目。
Grafana
Grafana是一个Go语言编写的跨平台的开源的度量分析和可视化工具,主要用于大规模指标数据的可视化展现,是网络架构和应用分析中最流行的时序数据展示工具。
部署
在这里我们监控MariaDB的话,需要安装Prometheus、Grafana,还有Prometheus的两个exporter:
- mysqld_exporter 收集MariaDB的数据
- node_exporter 收集Linux系统数据
先放下载链接:
https://prometheus.io/download/
https://grafana.com/grafana/download
部署Prometheus
首先是Prometheus,下载并解压:
1
2
3
| wget https://github.com/prometheus/prometheus/releases/download/v2.11.1/prometheus-2.11.1.linux-amd64.tar.gz
mkdir /usr/local/monitor/
tar -zxvf prometheus-2.11.1.linux-amd64.tar.gz -C /usr/local/monitor/
|
配置其中的prometheus.yml文件
1
2
3
4
5
6
7
8
9
10
11
12
13
14
15
16
17
18
19
20
21
| scrape_configs:
- job_name: 'prometheus'
static_configs:
- targets: ['localhost:9090']
- job_name: linux
static_configs:
- targets: ['localhost:9100']
labels:
instance: db1
- job_name: mysql
static_configs:
- targets: ['localhost:9104']
labels:
instance: db1
|
部署exporter
1
2
3
4
5
| wget https://github.com/prometheus/mysqld_exporter/releases/download/v0.12.0/mysqld_exporter-0.12.0.linux-amd64.tar.gz
tar -zxvf mysqld_exporter-0.12.0.linux-amd64.tar.gz -C /usr/local/monitor/
wget https://github.com/prometheus/node_exporter/releases/download/v0.18.1/node_exporter-0.18.1.linux-amd64.tar.gz
tar -zxvf node_exporter-0.18.1.linux-amd64.tar.gz -C /usr/local/monitor/
|
在MariaDB中创建prometheus用户,作为性能监控使用:
1
2
3
4
5
6
7
8
9
10
11
| MariaDB [(none)]> GRANT REPLICATION CLIENT, PROCESS ON *.* TO 'prometheus'@'localhost' identified by 'qwerty';
Query OK, 0 rows affected (0.001 sec)
MariaDB [(none)]> GRANT SELECT ON performance_schema.* TO 'prometheus'@'localhost';
Query OK, 0 rows affected (0.001 sec)
MariaDB [(none)]> flush privileges;
Query OK, 0 rows affected (0.002 sec)
MariaDB [(none)]> exit
Bye
|
在/usr/local/monitor/mysqld_exporter-0.12.0.linux-amd64目录中创建mysqld_exporter需要的my.cnf配置文件:
1
2
3
| [client]
user=prometheus
password=qwerty
|
部署Grafana
1
2
3
4
5
6
| wget https://dl.grafana.com/oss/release/grafana-6.2.5.linux-amd64.tar.gz
tar -zxvf grafana-6.2.5.linux-amd64.tar.gz -C /usr/local/monitor/
# 下载grafana-dashboards,该包中提供了大量的json格式文件的grafana dashboards,根据需要自行选择模板
wget https://github.com/percona/grafana-dashboards/archive/v2.0.0-beta4.tar.gz
tar -zxvf v2.0.0-beta4.tar.gz -C /usr/local/monitor/
|
启动服务
先启动Prometheus
1
2
3
4
5
6
7
8
9
10
11
12
13
14
15
16
| cd /usr/local/monitor/prometheus-2.11.1.linux-amd64
./prometheus
level=info ts=2019-07-23T14:25:25.009Z caller=main.go:293 msg="no time or size retention was set so using the default time retention" duration=15d
level=info ts=2019-07-23T14:25:25.009Z caller=main.go:329 msg="Starting Prometheus" version="(version=2.11.1, branch=HEAD, revision=e5b22494857deca4b806f74f6e3a6ee30c251763)"
level=info ts=2019-07-23T14:25:25.009Z caller=main.go:330 build_context="(go=go1.12.7, user=root@d94406f2bb6f, date=20190710-13:51:17)"
level=info ts=2019-07-23T14:25:25.009Z caller=main.go:331 host_details="(Linux 4.18.0-25-generic #26~18.04.1-Ubuntu SMP Thu Jun 27 07:28:31 UTC 2019 x86_64 top (none))"
level=info ts=2019-07-23T14:25:25.009Z caller=main.go:332 fd_limits="(soft=1024, hard=1048576)"
level=info ts=2019-07-23T14:25:25.009Z caller=main.go:333 vm_limits="(soft=unlimited, hard=unlimited)"
level=info ts=2019-07-23T14:25:25.010Z caller=main.go:652 msg="Starting TSDB ..."
level=info ts=2019-07-23T14:25:25.010Z caller=web.go:448 component=web msg="Start listening for connections" address=0.0.0.0:9090
level=info ts=2019-07-23T14:25:25.021Z caller=main.go:667 fs_type=EXT4_SUPER_MAGIC
level=info ts=2019-07-23T14:25:25.021Z caller=main.go:668 msg="TSDB started"
level=info ts=2019-07-23T14:25:25.021Z caller=main.go:738 msg="Loading configuration file" filename=prometheus.yml
level=info ts=2019-07-23T14:25:25.022Z caller=main.go:766 msg="Completed loading of configuration file" filename=prometheus.yml
level=info ts=2019-07-23T14:25:25.022Z caller=main.go:621 msg="Server is ready to receive web requests."
|
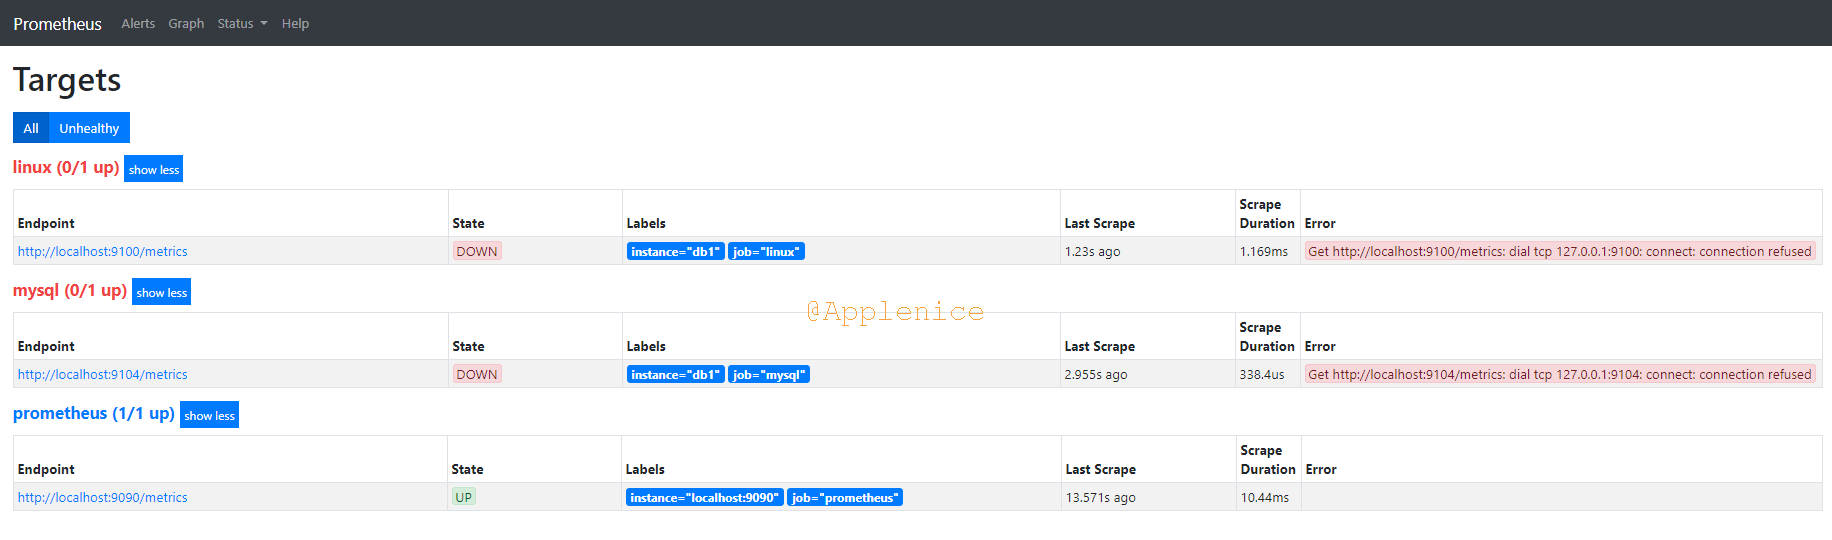
此时访问http://localhost:9090/graph,在Status->Target中可以看到系统监控和数据库监控都处于DOWN的状态,如下图所示:
拉起mysqld_exporter:
1
2
3
4
5
6
7
8
9
10
11
12
13
| cd /usr/local/monitor/mysqld_exporter-0.12.0.linux-amd64
./mysqld_exporter --config.my-cnf="my.cnf"
INFO[0000] Starting mysqld_exporter (version=0.12.0, branch=HEAD, revision=90f7449fc6bc49d4633060297dc490a1b9f8d88e) source="mysqld_exporter.go:257"
INFO[0000] Build context (go=go1.12.7, user=root@92cf65d0108d, date=20190710-11:49:49) source="mysqld_exporter.go:258"
INFO[0000] Enabled scrapers: source="mysqld_exporter.go:269"
INFO[0000] --collect.global_variables source="mysqld_exporter.go:273"
INFO[0000] --collect.slave_status source="mysqld_exporter.go:273"
INFO[0000] --collect.global_status source="mysqld_exporter.go:273"
INFO[0000] --collect.info_schema.innodb_cmpmem source="mysqld_exporter.go:273"
INFO[0000] --collect.info_schema.query_response_time source="mysqld_exporter.go:273"
INFO[0000] --collect.info_schema.innodb_cmp source="mysqld_exporter.go:273"
INFO[0000] Listening on :9104 source="mysqld_exporter.go:283"
|
拉起node_exporter:
1
2
3
4
5
6
| cd /usr/local/monitor/node_exporter-0.18.1.linux-amd64
./node_exporter
INFO[0000] Starting node_exporter (version=0.18.1, branch=HEAD, revision=3db77732e925c08f675d7404a8c46466b2ece83e) source="node_exporter.go:156"
INFO[0000] Build context (go=go1.12.5, user=root@b50852a1acba, date=20190604-16:41:18) source="node_exporter.go:157"
INFO[0000] Enabled collectors: source="node_exporter.go:97"
|
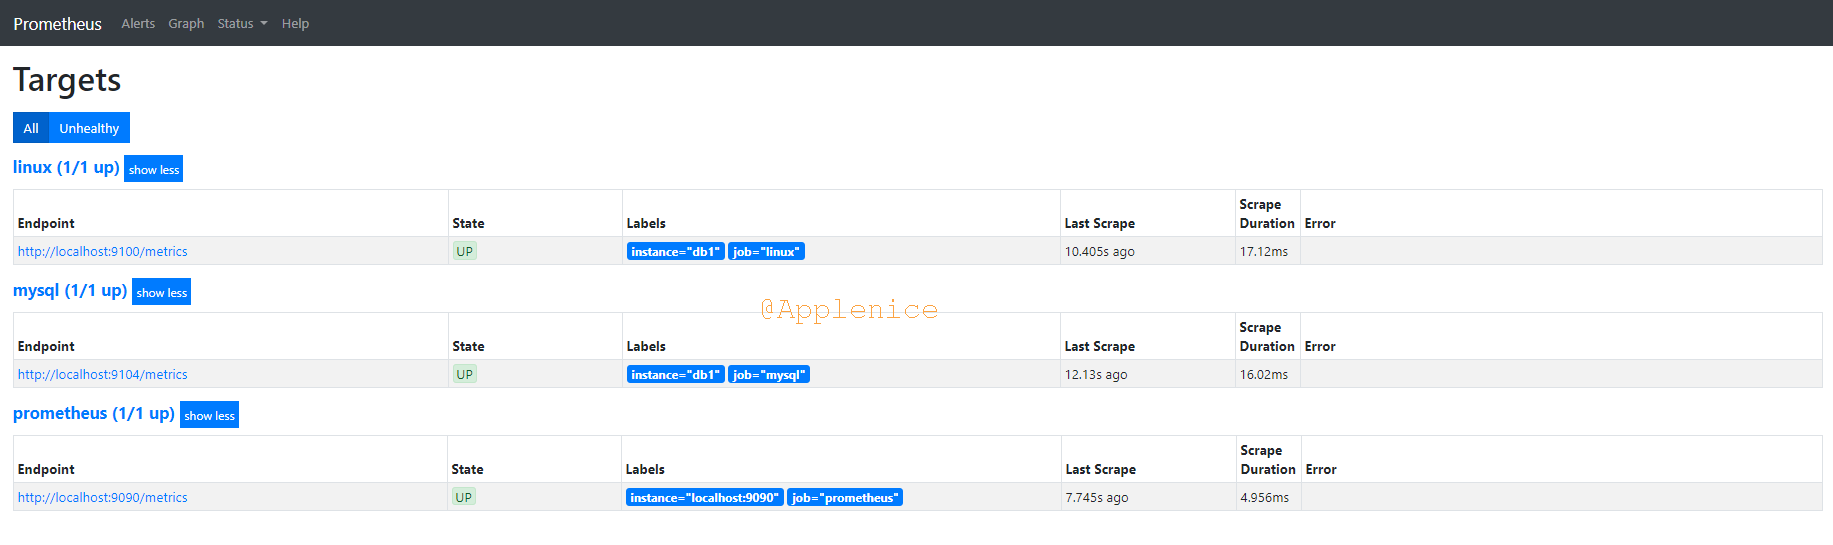
再次访问http://localhost:9090/targets,可以看到均已是UP的状态了。
拉起Grafana:
1
2
| cd /usr/local/monitor/grafana-6.2.5/bin/
./grafana-server
|
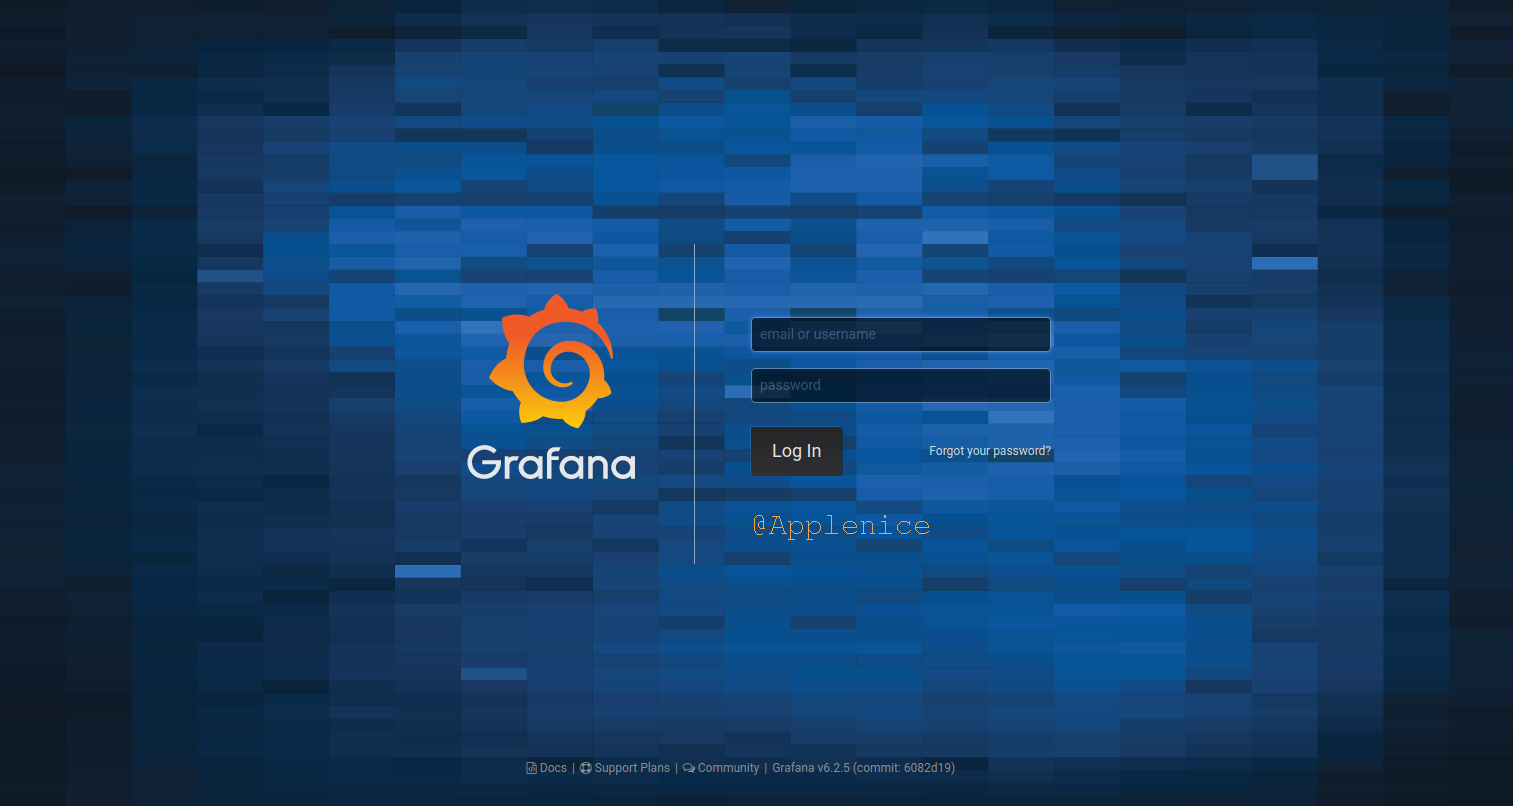
访问http://localhost:3000,即可进入登录页面,如下所示:
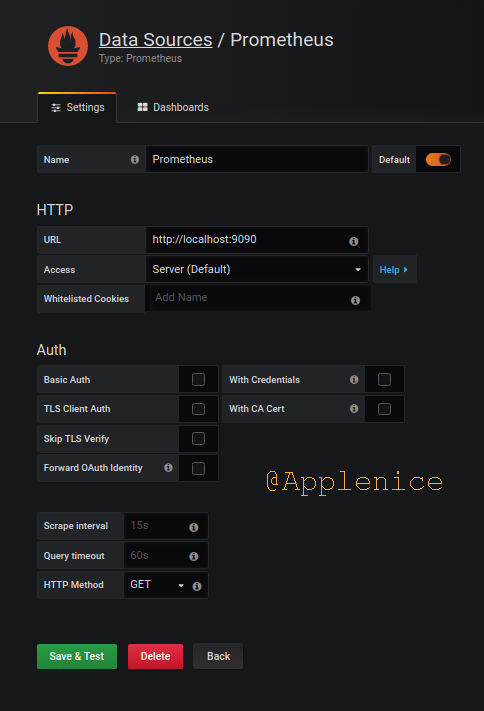
在Host Dashboard页面,需要点击Add data source,选择Prometheus后,添加信息即可:
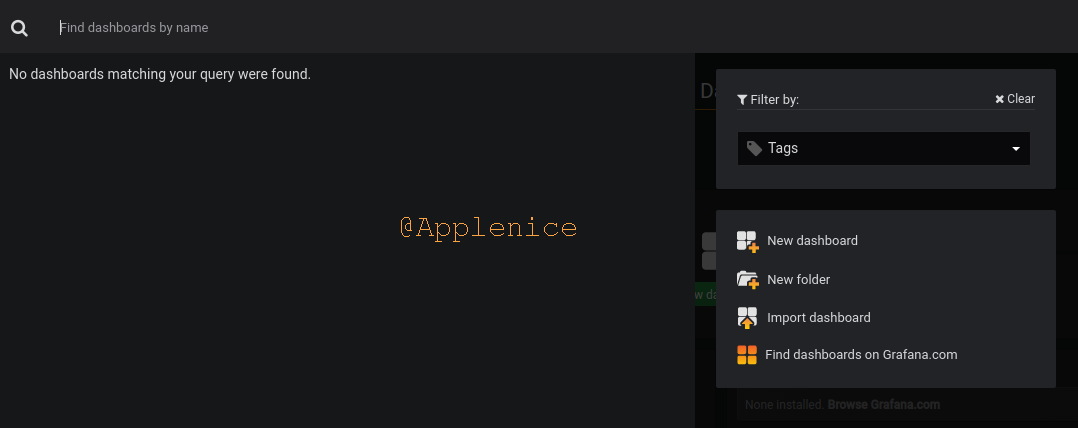
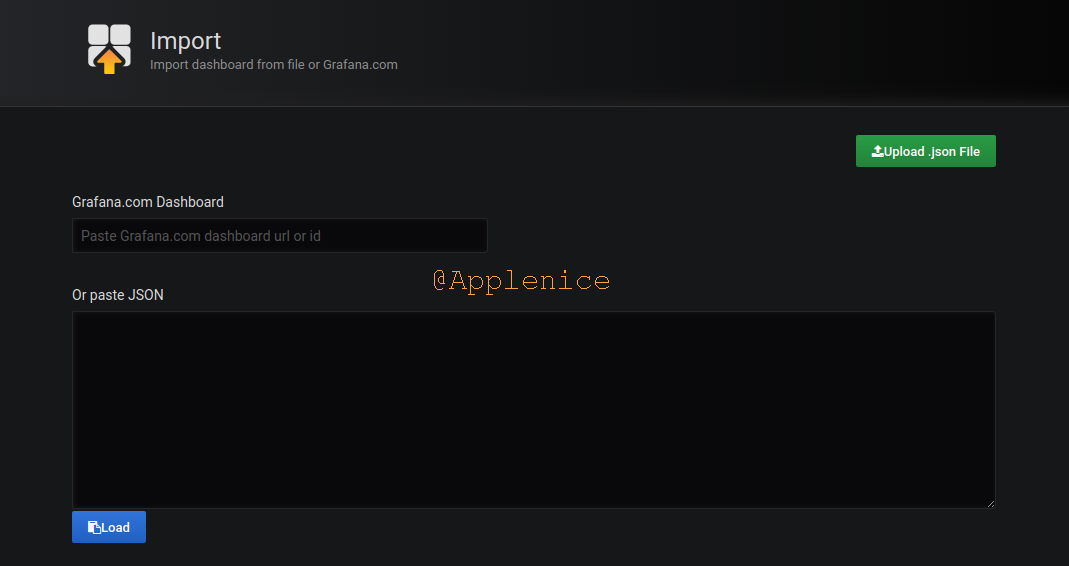
点击Home->Import dashboard,选择我们之前下载好的grafana-dashboards包中的模板,路径:/usr/local/monitor/grafana-dashboards-2.0.0-beta4/dashboards,上传后就可以使用了。
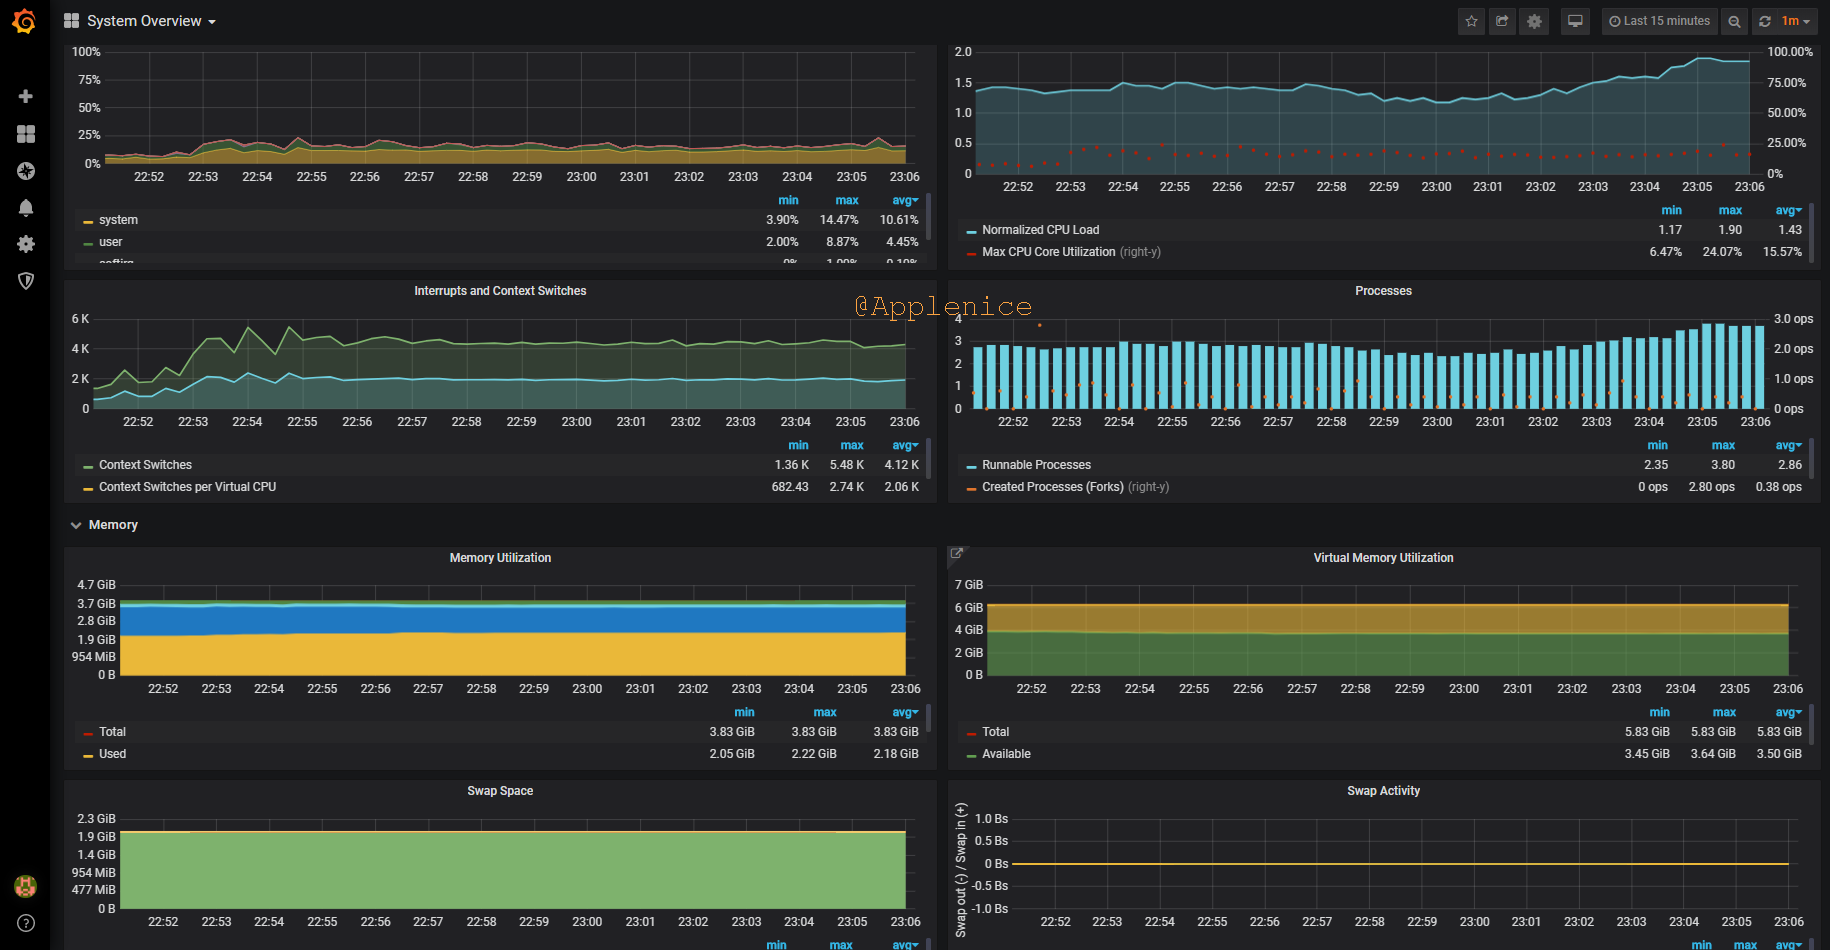
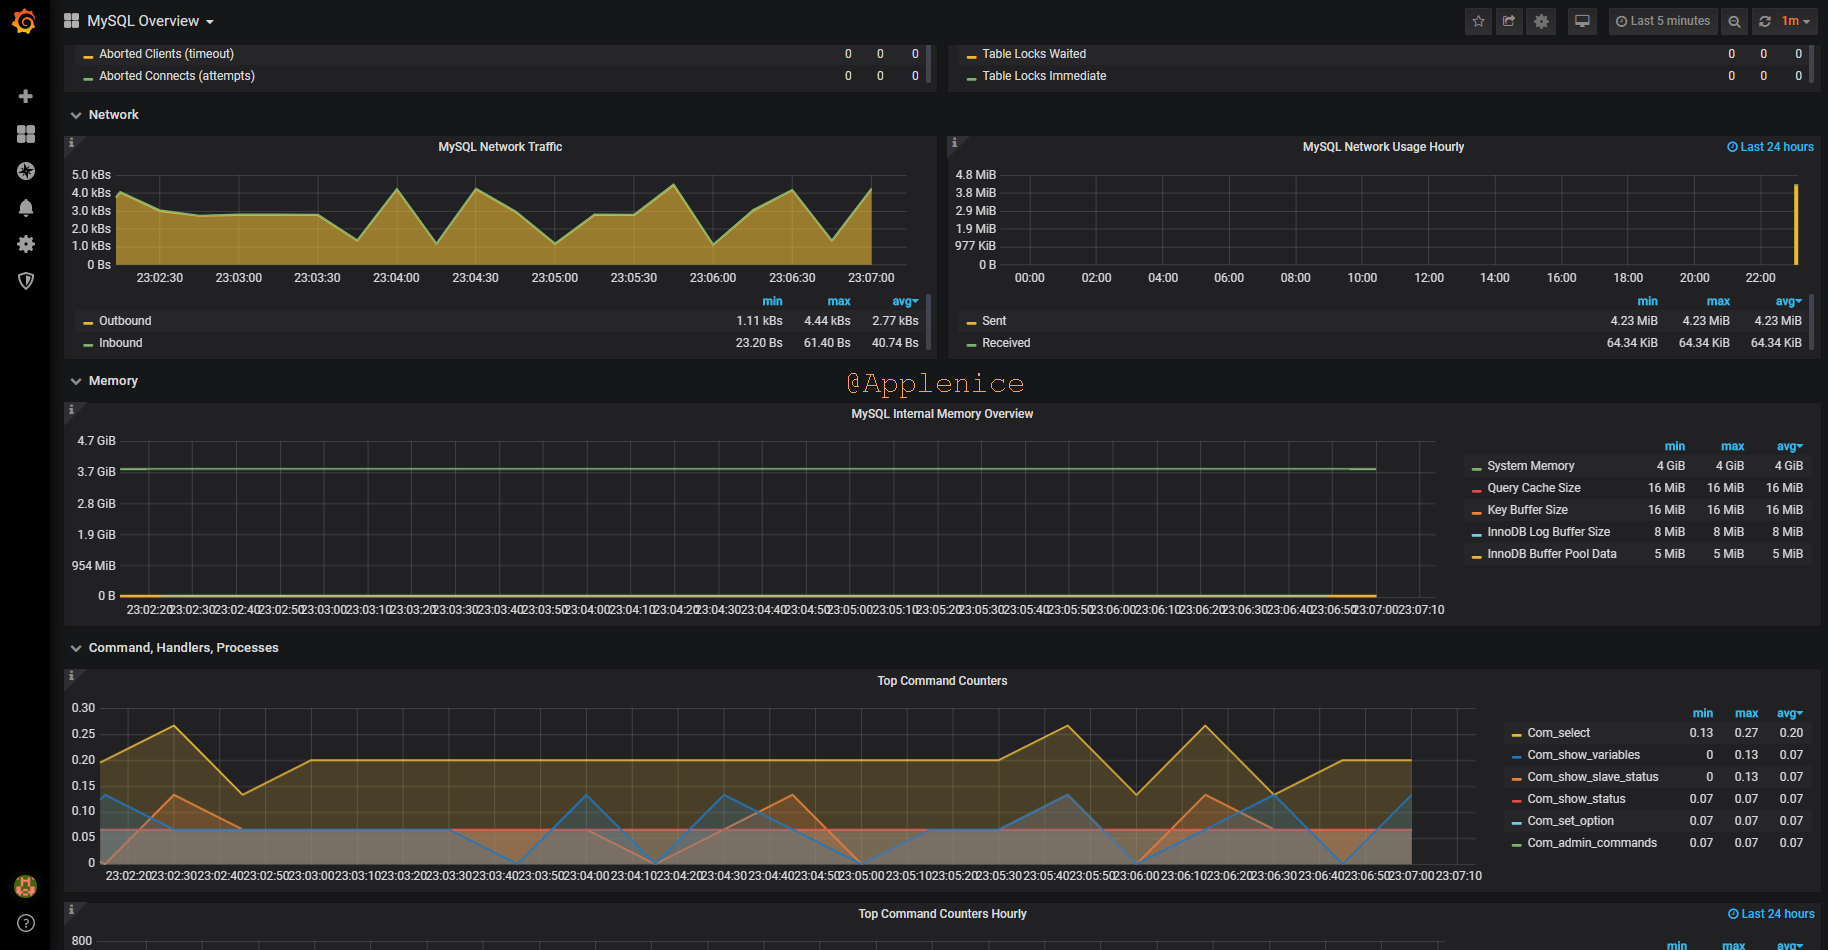
下面放两张效果图,还是很炫酷的😄
OK,先这样,后面有时间可以多学习一下Prometheus和Grafana的使用。
参考
https://www.ibm.com/developerworks/cn/cloud/library/cl-lo-prometheus-getting-started-and-practice/index.html
https://segmentfault.com/a/1190000007040144
https://zhuanlan.zhihu.com/p/42271689