[GIN-debug] [WARNING] Running in "debug" mode. Switch to "release" mode in production.
 - using env:	export GIN_MODE=release
 - using code:	gin.SetMode(gin.ReleaseMode)

[GIN-debug] GET    /debug/pprof/             --> github.com/gin-contrib/pprof.RouteRegister.WrapF.func1 (3 handlers)
[GIN-debug] GET    /debug/pprof/cmdline      --> github.com/gin-contrib/pprof.RouteRegister.WrapF.func2 (3 handlers)
[GIN-debug] GET    /debug/pprof/profile      --> github.com/gin-contrib/pprof.RouteRegister.WrapF.func3 (3 handlers)
[GIN-debug] POST   /debug/pprof/symbol       --> github.com/gin-contrib/pprof.RouteRegister.WrapF.func4 (3 handlers)
[GIN-debug] GET    /debug/pprof/symbol       --> github.com/gin-contrib/pprof.RouteRegister.WrapF.func5 (3 handlers)
[GIN-debug] GET    /debug/pprof/trace        --> github.com/gin-contrib/pprof.RouteRegister.WrapF.func6 (3 handlers)
[GIN-debug] GET    /debug/pprof/allocs       --> github.com/gin-contrib/pprof.RouteRegister.WrapH.func7 (3 handlers)
[GIN-debug] GET    /debug/pprof/block        --> github.com/gin-contrib/pprof.RouteRegister.WrapH.func8 (3 handlers)
[GIN-debug] GET    /debug/pprof/goroutine    --> github.com/gin-contrib/pprof.RouteRegister.WrapH.func9 (3 handlers)
[GIN-debug] GET    /debug/pprof/heap         --> github.com/gin-contrib/pprof.RouteRegister.WrapH.func10 (3 handlers)
[GIN-debug] GET    /debug/pprof/mutex        --> github.com/gin-contrib/pprof.RouteRegister.WrapH.func11 (3 handlers)
[GIN-debug] GET    /debug/pprof/threadcreate --> github.com/gin-contrib/pprof.RouteRegister.WrapH.func12 (3 handlers)
[develop@localhost ~]$ go tool pprof --seconds 60 http://localhost:8088/debug/pprof/profile Fetching profile over HTTP from http://localhost:8088/debug/pprof/profile?seconds=60 Please wait... (1m0s) Saved profile in /home/develop/pprof/pprof.gin_pprof.samples.cpu.001.pb.gz File: gin_pprof Type: cpu Time: Oct 27, 2024 at 10:26pm (CST) Duration: 60.01s, Total samples = 47.91s (79.83%) Entering interactive mode (type "help" for commands, "o" for options) (pprof) exit [develop@localhost ~]$
其中收集的性能数据文件会保存在Saved profile所在的行。
5、这里操作系统上,我使用是CentOS 7,在读取数据之前,需要安装graphviz包:
1
sudo yum install graphviz
6、通过pprof读取第4步保存完的文件:
1 2 3 4 5
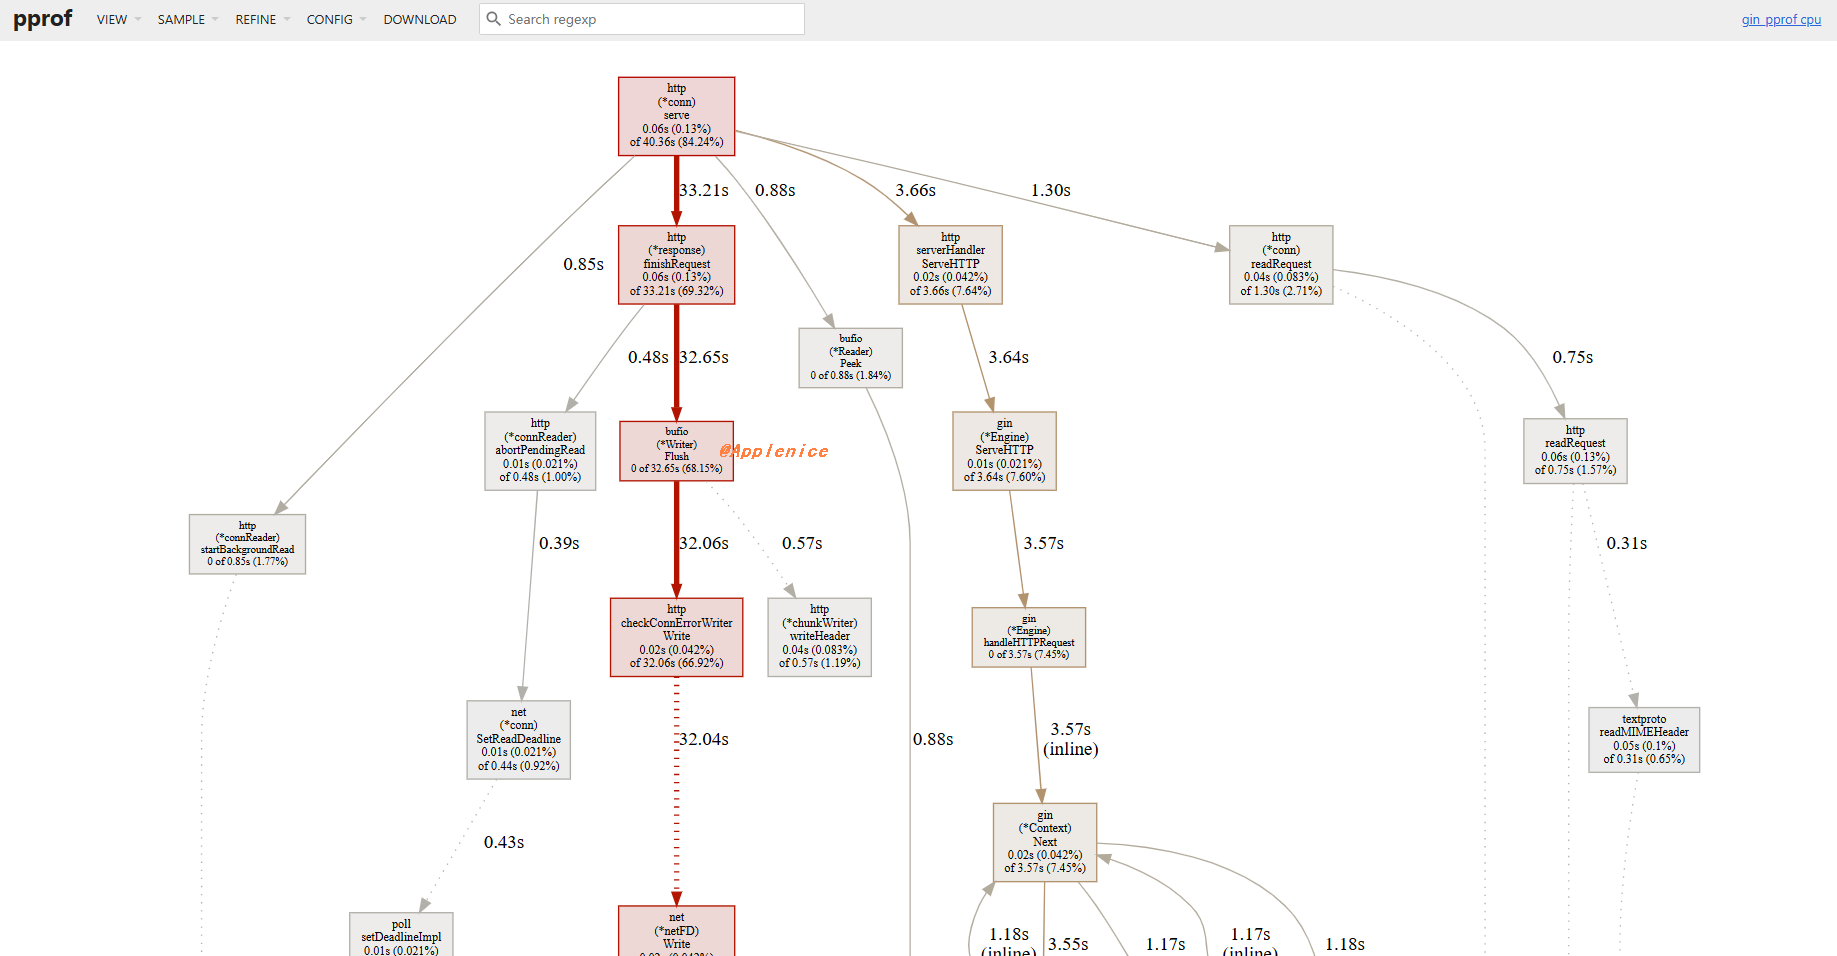
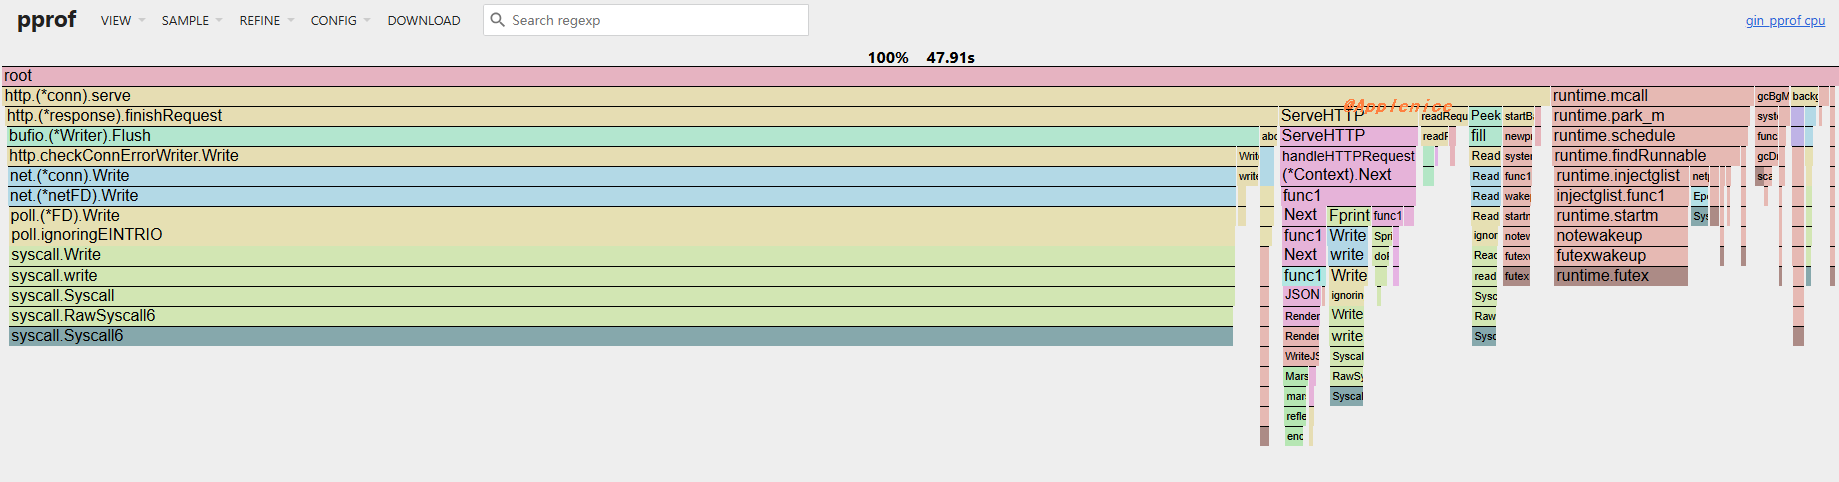
[develop@localhost ~]$ go tool pprof -http 0.0.0.0:20000 /home/develop/pprof/pprof.gin_pprof.samples.cpu.001.pb.gz
Serving web UI on http://0.0.0.0:20000
Failed to open connection to "session" message bus: Unable to autolaunch a dbus-daemon without a $DISPLAY for X11
Error: no DISPLAY environment variable specified